This is a case study into how Nix and NixOps can make deploying and maintaining a system easier and more fun for you.
Objective
The objective is to stress test an application under heavy load, identify the performance bottlenecks, and implement changes to remove the performance bottlenecks.
Scenario
For this study, I will create a fictional IOT application that models a real IOT deployment.
The application is a fleet of network-connected battery-powered hot water kettles that boil water to make cups of tea. We would like to grow our fleet to meet demand for cups of tea, and expect that the number of devices in the field may soon reach 20,000.
It’s absolutely essential that the system to command the fleet be reliable and fast because cups of tea are very important.
Therefore, the current status of every device, and the next command to send (based on historical data and other information) must be always available. The system must have enough capacity to handle the expected number of devices.
Device client
A network-connected electric hot water kettle runs software which is able to send HTTP requests but otherwise can’t do much else. All computation runs in the cloud (i.e. on our servers). The IOT kettles will thus poll a HTTP server for commands, and regularly send sensor measurements to be logged in a database.
Sensor measurements
The kettles have a variety of sensors and will send the following information every 30 seconds:
- Device ID (128 bit UUID)
- Time according to device’s clock (UTC)
- Battery charge now (mWh)
- Battery charge when full (mWh)
- Battery charge/discharge rate (mW, positive is charging)
- Ambient temperature (℃)
- Reservoir water temperature (℃)
- Reservoir water level (mL)
Switches
The kettles also have switches to control charging of their batteries from mains power, and solenoids to control filling of the reservoir, and pouring from the reservoir. The possible commands are:
| Switch | On | Off |
|---|---|---|
| Battery charger | Charge | Don’t charge |
| Fill reservoir | Fill | Don’t fill |
| Flush reservoir | Flush rate (mL/s) | Don’t flush |
Statistics queries
The actual commands to send to the devices would be determined by querying current and historical sensor data for statistics. As an example, for this application, the following statistics will be calculated:
- Total number of measurements taken.
- Number of devices in the field.
- Total battery charge of all devices together.
- Total water reservoir volume of all devices in aggregate.
- The mean temperature by hour of day for all devices, and standard deviations.
- The total “potential energy” of all devices. That is, the sum of the difference between water and ambient temperatures multiplied by water volume for every device.
Test environment
The test environment has the following components:
- database
- app server
- monitoring environment
- load testing tool
- fake data seeding script
I will use NixOps to define the configuration of all components and the network of machines they will be deployed to.
Database
I choose PostgreSQL as the database because it’s a great general purpose relational database. Its versatility allows the system to be easily adapted to future requirements without redesigning everything.
PostgreSQL is known to perform reasonably well in general, and at this point it’s unclear what the limits of its performance in this particular system will be.
However, it is certain that the measurements table will continue to grow in size as time-series data is inserted. As currently implemented in PostgreSQL, time to INSERT rows increases when table size increases. The recently developed TimeScaleDB plugin addresses this limitation, so we will use it.
For the whole setup, see load-test-app.nix
For the database schema see app/src/migrations/001-load-test.sql.
Application server
The model data collection service is a Haskell Servant REST API.
The API is defined in app/src/API.hs. It has three endpoints:
GET /command– the device asks what it should be doing for the next time interval.POST /measurement– the device sends its current state to be logged.GET /statistics– an example endpoint which calculates statistics on the historical dataset. For example: number of measurements, total current battery charge.
The service uses Opaleye to access the database, just because it’s a nice way of making queries.
The application server’s database connection pool is configurable of course, but for the time being it’s fixed to 4 stripes of 10 connections.
Hypothesis
To determine whether the system will have enough capacity for the planned scenario of 20,000 devices, we need to reason about the amount of data and how it is processed.
The app server doesn’t do much except JSON decoding and preparing database statements to execute, and maybe a little bit of debug logging.
The database will need to store many sensor measurements over a long period. For the 20,000 device scaling scenario, my estimate for the write rate is 667 records logged per second.
I’m also unsure whether TimeScaleDB will work as well as claimed by its authors.
Simultaneously, the database also needs to run statistical queries over the historical data. However, this only needs to be done occasionally by one processes.
So, my hypothesis is that performance characteristics of the system likely centre around the amount of data being written to the database.
How to test
The goal is to make a realistic production-like environment for the app and then feed it data until it fails. The monitoring tools should keep enough metrics to hint at where the bottlenecks are and what are the application’s performance characteristics.
The monitoring tools have attractive and helpful web interfaces which facilitates interactive experimentation with testing.
Load testing
Locust will be use to load test the application. It is easy to customize and provides a very convenient web interface to kick off the test.
scripts/locustfile.py creates numerous clients which login to the model app with a random device ID then repeatedly poll the /command endpoint and push random data to the /measurement endpoint.
See load-test-locust.nix.
Fake data seeding script
The script app/app/fill-database.hs generates a few years’ worth of measurements so that the performance of the database can realistically be measured.
Monitoring
The monitoring environment is Prometheus and Grafana. Prometheus is configured to collect and store the following metrics:
- GHC runtime system metrics, especially garbage collector stats.
- App node’s metrics that can indicate the utilization and saturation of various resources.
- App REST API server metrics, such as request duration.
- Metrics from Locust so the load test can be cross-checked with other metrics.
- Linux cgroup metrics from cAdvisor – i.e. metrics such as CPU usage of specific systemd services.
See monitoring.nix.
Test “hardware”
For the sake of convenience, I am running the test on my laptop using the VirtualBox backend of NixOps. This limits the size of the test but should still provide some useful initial information.
- Host: Intel Ivy Bridge, Core i7, 4 cores, 4MB cache; 8GB memory; SSD
- VirtualBox 2xVCPU 2GB – server app, postgresql, monitoring software
- VirtualBox 1xVCPU 1GB – locust
The code
All the code for the model application and test environment is on GitHub.com/rvl/load-test.
To try the test harness on VirtualBox:
$ nixops create -d load-test load-test-network.nix load-test-vbox.nix
$ nixops deploy -d load-test
The various tools can be accessed at the following URLs (IP addresses might vary slightly)
- Locust: http://192.168.56.101:8089/
- Prometheus: http://192.168.56.102:9090
- Grafana: http://192.168.56.102:3000
- Model App: http://192.168.56.102:8080/metrics
Run the test
Visit the locust web interface and start a test with:
- Swarm size: 20000
- Hatch rate: 200
Test results
Attempt 1
The first test failed due to to the default maximum number of open files being too small. Of course.
This was easily fixed by increasing the global limit in load-test-common.nix and service limit in load-test-app.nix.
Attempt 2
In the second test a lot of integrity errors were being logged by PostgreSQL. This is because the app’s “get or create device” function used exception handling and transaction rollback to handle the case where the device already existed. It worked OK but looked messy so I fixed the query.
Attempt 3
This worked well up until about 16,000 users. Response times slowly crept up until “connection reset” and “no response” errors started appearing. This means a bottleneck has been found.
To identify the bottleneck, I apply the USE method. Increasing response times indicates saturation of some resource.
- The systemd journal shows no errors in app server or database, and
dmesgis clear. - CPU usage is high.
topsays that the backend is using about 75% CPU. - Memory is not exhausted – so there is no problem with swapping.
- According to
systemctl status postgresql, the PostgreSQL connection threads are all saying “idle in transaction”. - PostgreSQL is not using high amounts of CPU.
- There are no large IO wait values.
- After stopping the Locust swarm, the app server continues to use high CPU for several minutes, as the number of measurements in the database continues to increase. This indicates that a large queue somewhere is slowly draining.
- The app server’s memory usage started expanding as response times increased, then fell back after the activity stopped. This indicates that the incoming requests were queued in the app server.
My conclusion from this is that my hypothesis is wrong, and the server application is the bottleneck, not the database.
Charts
The Grafana dashboard for this load test is exported and viewable in an interactive chart viewer.
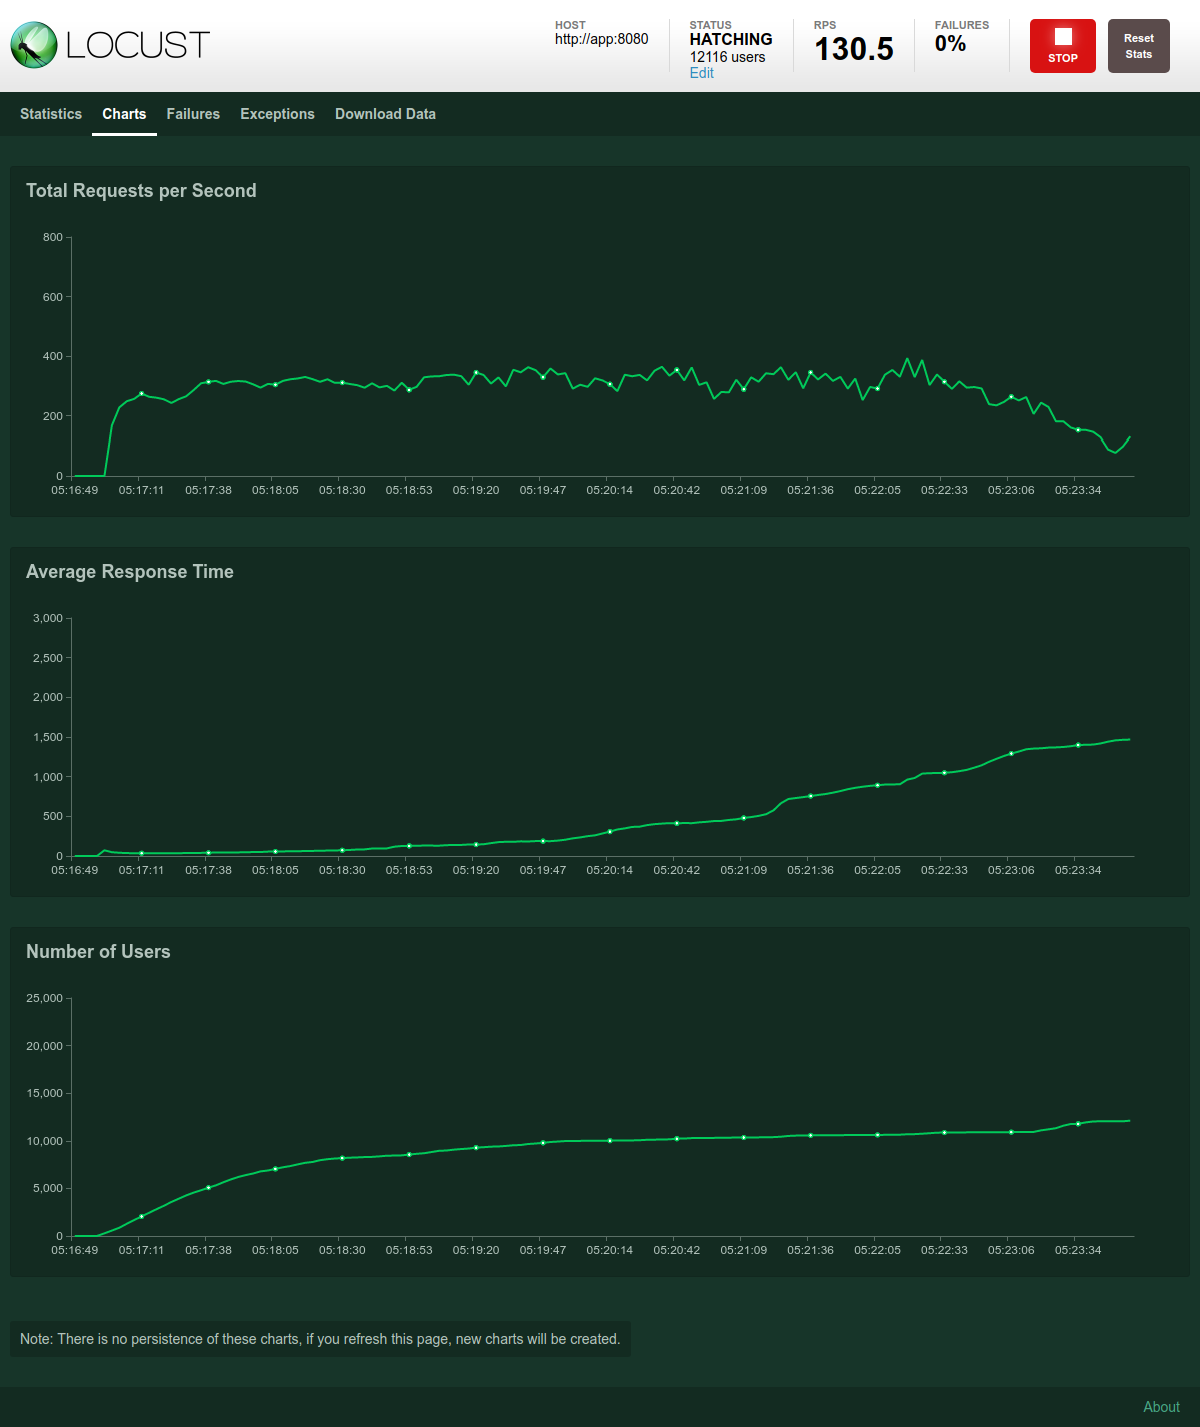
Locust load test
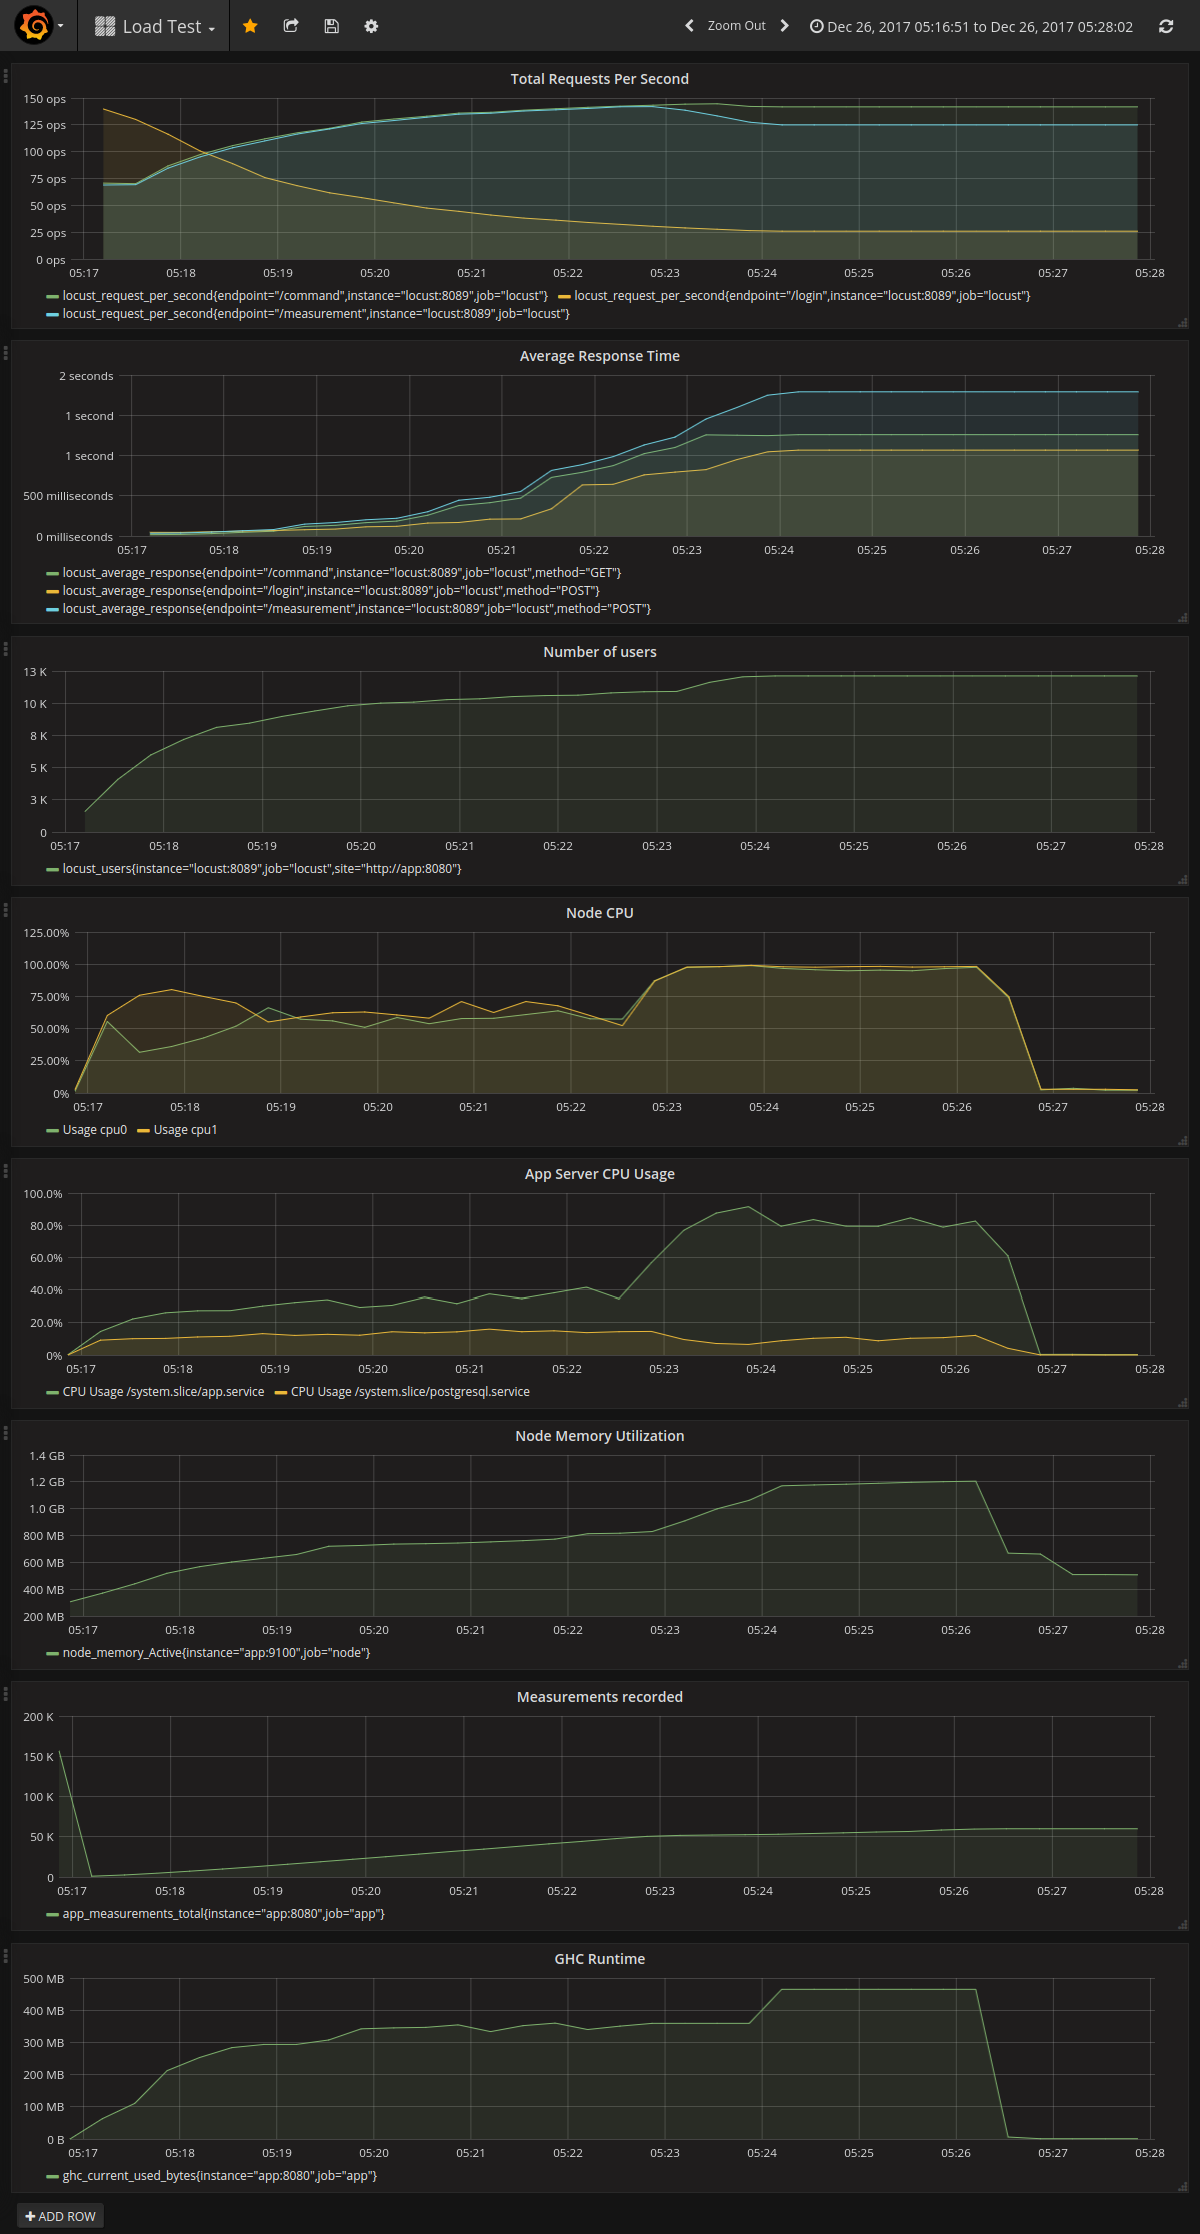
Metrics from load test
What to do
There are two possible courses of action: make the app server faster, or add more app servers.
The request rate of about 300 RPS is slightly disappointing, so we can benchmark the app with criterion to see what I’ve done wrong. Alternatively, the app server can be allocated more or better virtual CPUs.
Because the app is stateless, it’s fairly simple to increase the number of app servers using a load balancer.
In the next post, I will make one of these changes, measure the results, and try to see if we can stress the database a little.
Summary
This study shows that it’s quite easy to get a sophisticated test environment running with NixOps. The Nix code is concise and explains itself fairly well.
I didn’t need to create anything new except for the model application. Everything else is just enabling NixOS services provided by the NixOS project.
The model application is built from source and packaged using Nix. It is deployed in the same way as the other services. If the application changes, it is automatically rebuilt and restarted. Nix provides a pure and reproducible development environment for Haskell.
The exact same deployment code can be shared between test and production environments. The only differences would be the type of infrastructure and a few variables.
With other systems you might be lucky enough to stick things together like Lego. Nix is like a 3D printer, in that you can re-use and combine other people’s designs, but you can also customise the result to fit your needs exactly.
References
- USE method
- NixOps Manual
- Prometheus on NixOS – this code was adapted to fit this case study.
- hercules-ci – Haskell backend code was used as template for the model app.
- Hydra Tutorial – used NixOps network as a template.
- TimeScaleDB
- Haskell Performance Checklist
- Haskell Performance Debugging