While bike touring, I like to bring a GPS with me. It sometimes helps for navigation but is mostly so we can have a GPS track log as a memento of the tour.
These GPS track logs can be processed and combined with our photos and tour diaries so present a nice summary of the tour.
If you are not interested in programming, then I suggest to stop reading now, go to the map, click around a bit, and look at the cool places to go bike touring.
What follows are the details of how the tour map was made, how it is different from the average web site, my experiences and lessons learned.
Contents
Requirements
The goal was to build a web site to show GPS tracks and blog entries from bike tours together with easy navigation between different days.
I didn’t really want to run an app server for this, but just serve static files with a normal web server.
The extra data such as dates, distances, place names, should be easy to copy from my notebook into a file.
The system to process GPS data should run as quickly as possible and not rebuild things that haven’t changed. It should also handle adding of new data such as new track logs or data file entries.
Old System
The previous system processed the GPS track logs using gpsbabel, gnuplot, and Python scripts, driven by a Makefile. The web site would show track logs in an embedded Google Maps iframe, and elevation charts as PNG images.

Old Makefile build process
The main problems for me here with make are:
makeneeds to be given a list of targets to build, but these are determined externally from the data structure defined indata.py.makeusually expects the number of input files to be fully determined by the number of output files. However, in this case, for each output file (daily KML) there were zero or more GPS track logs depending on when I switched on/off my GPS logger.
It’s possible to work around these limitations in Make but the result is a complicated mess of the shell, foreach, call, and wildcard functions of GNU Make.
The other problems with the site is that the embedded Google Maps and elevation charts weren’t really connected to each other, and it was difficult to update the tour data file to add a new tour.
Basically, it worked OK, but would be better if it were redesigned with better tools.
Build
Shake is now used for converting and building the geo data.
The good thing about Shake is that it captures the essence of make, which is to build a target by building its dependencies first. But a Shake file is also a Haskell program which adds the power of a general-purpose language while still appearing simple and declarative.
Relevant code:
Input and output files

Shake build process for each tour
Apart from the GPS track logs (in either SBN or GPX format), there are hand-written data files in YAML format, one for each tour. The values are loaded from YAML into proper Haskell data types which makes calculations easy.
Track logs are concatenated and converted to the GeoJSON format which is supported by Leaflet. To reduce transfer times and the number of line segments rendered, there are three levels of detail, achieved by culling points which don’t significantly change the shape of the line. Trackpoint removal is done by the gpsbabel simplify filter. The highest level of detail is for a single day. There is also an intermediate level of detail for a track which shows the entire tour. The lowest level of detail is for the map of all tours, which comes out as about 1MB of GeoJSON (85KB when gzip-encoded by NGINX web server).
The parsed tour YAML data is also converted to JSON for use by the frontend to show the list of tours, days of each tour, etc.

Shake build process for each day of tour
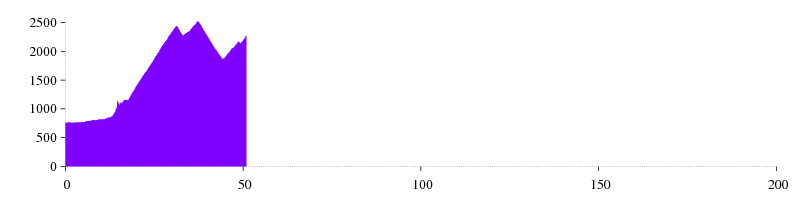
Elevation profiles
The elevation profiles are drawn with Chart.js, so a simple array of data points needs to be created in JSON format.
This is done by pairing the elevation of each track point with a running total of distance travelled.
HXT is used to load the GPX and then Naqsha provides geo data types and a function to calculate distance between points on the earth.
To reduce the amount of chart points to render, the Ramer–Douglas–Peucker line simplification algorithm seemed appropriate, and so I copy&pasted some code which implemented it.
Good things about Shake
Because Shake is Haskell, this means the input data can be understood in a high-level way by the build system. It’s easy to define input and output files (build rules) with list comprehensions.
Shake allows defining higher-level build actions, such as a wrapper function for invoking gpsbabel. This eliminates repetition and makes the build actions easier to read.
Shake is more or less the same as make in terms of ability to execute many build actions in parallel. It’s important to note this because if you just write your own program to do the build, you won’t benefit from implicit parallelism that a dependency-based build system gives you..
Shake would usually spawn a program as a build action, put you can also run any Haskell function as the build action. This is handy when combined with the excellent facilities for reading and writing JSON.
Not good things
It has to be said again – FilePath/String/Text – they are a pain in the neck. Shake keeps things simple by using Strings everywhere and the alias type FilePath = String. However other packages such as Aeson use Text, so packing and unpacking will be necessary.
Things get considerably worse when mixing Shake with Hakyll (static web site builder) or Turtle (shell scripting in Haskell). The problem is that all three have different types for file paths, globs, etc. Prepare to get confused.
I considered using the GPX library on Hackage but it’s not maintained and doesn’t build any more. Also there doesn’t yet seem to be a standard library for geo data types.
When I tried using HXT for updating track names within the tour GPX, I realised that it uses an appalling amount of memory. I had to use XSLT instead, which is also bad, but works at least.
Naqsha types feel a bit clumsy and missing JSON instances. There are multiple geo libraries around which do the same thing more or less.
YAML
The tour descriptions and daily info are written in YAML format.
Previously I had this data in a Python dict, loaded by importing the data.py module. Many Python programs use this pattern but I found it cumbersome.
People say bad things about YAML but I like it, because it’s quite simple and easy to edit. Usually what they are really saying is that they don’t like representing program control flow and interdependencies in a format which is mostly the same as JSON.
YAML is definitely misused in things like Ansible. What they need is Nix. Failing that, what they need is Dhall.
Frontend Prototype
The first version of the frontend was written in JavaScript with VueJS. It was extremely easy to get started with a working app, using a template from vue-cli.
Great
The webpack template has hot reloading, so that individual components are refreshed on code change, rather than the entire page. Needless to say, this is ideal for prototyping. Fast feedback loops are good in general.
The idea of *.vue component files with scoped stylesheets is very helpful, and makes web development less clumsy. Now there finally seems to be a JavaScript module system that isn’t crap. The way they achieved this is by building everything with webpack loaders before sending it to the web browser.
In general, the development tools npm and webpack work very well for their designed purpose. Just don’t look at how the sausage is made.
I am still extremely pleased with VueJS. It is just like the late 1.x versions of AngularJS but with various silliness removed (such as dependency injection).
Problems
What I had most trouble with was finding guidelines on how to organise VueJS components. There are components which are used as views for the router, and there are the normal components which are small UI elements nested in other components. Essentially, these two categories are the same, but I want to keep the page-level components apart so that it’s easy to understand the app just by listing the source files.
I also had trouble deciding whether to use nested routers and/or named views. The navigation structure of this app is a tree of depth three. There are also two distinct elements which must be updated according to the route. In the end, I decided on neither nested routers nor named views. I have never been able to use these router features satisfactorily.
I thought it would be helpful to use a VueJS component which wraps Leaflet, such as Vue2Leaflet. Actually I shouldn’t have bothered because it didn’t work very well with updating layers, and didn’t provide a good way of accessing the Leaflet objects.
Chart.js is OK for basic charts and looks good but is buggy when resizing and replacing data. For example, you can’t easily resize the chart canvas to make the axes bigger. It might have been better to use D3 directly.
In the end the app looked OK on a desktop browser, but then didn’t appear very well at all on mobile. It turned out to be difficult to adapt without completely re-organising. The lesson here is to design for the smallest screen first, then expand.
Haskell Miso Frontend
The VueJS frontend suffered from a significant fault – it was written in JavaScript and not Haskell.
I thought I would try the relatively new Miso library (version 0.9), which copies the Elm Architecture. Miso is implemented for GHCJS, the Haskell compiler which produces JavaScript.
This is a good example to test the capabilities of a framework because it has less basic stuff that is easily representable by pure functions, and more grabbing of external data, updating stateful UI elements, and presenting data from disparate sources together.
Good things
Miso is well documented and comes with a good set of examples. As far as I can tell it’s bug-free.
It’s possible to share data types between the build system and the frontend.
It’s nice to put together views as pure functions of the data model.
Missing things
There is no good way in Miso to insert HTML verbatim into views. Normally, this isn’t needed, or is a bad idea due to XSS possibilities. But sometimes you have a trusted HTML document such as a blog post which just needs to be put into a view.
For interfacing with external JavaScript libraries such as Leaflet, there need to be lifecycle hooks (create/mount/unmount/destroy) somewhere so that JavaScript code can set up/tear down the external library.
Router
It’s good that Miso has a router, but it seems a little bit green. The very cool thing about the router is that it uses Servant.API types, so you can capture any data type representable by a string, and compose routes.
I would have have liked to see the Miso router example use Capture, because this is an essential part of routing.
For displaying the tour map, I needed to represent the current route as a sum data type. Routing is normally expressed as URI -> View with the runRoute function. What I have are two functions: URI -> MyRouteType and MyRouteType -> View. This is a little bit odd because there are now two representations of the route. I would like to clean that up.
These seems to be no way of reversing urls so they can be put into a[href] attributes. All navigation is done by onClick events. Single-page applications are not supposed to violate basic principles of the WWW in this way.
There is no way to supply a base URL of the app. Some particularly ugly URI munging was required in this app so that it would work both when running at /tour/ (live web site) and / (development server).
How long is a piece of String
String/JSString/Text/MisoString oh what a pain! Reflex (Platform) ameliorates this by replacing the text package in base with its own that is using JSString internally.
Also throw in the URI string-like type to add further annoyance.
Miso provides a function toMisoString :: str -> MisoString, with the shortcut function ms. However I couldn’t find a utility functtion to convert in the other direction(s).
GHCJS Marshalling.
The basic GHCJS FFI is quite good, especially with its automatic newtype unwrapping. There are three important resources for using the FFI:
- the ghcjs-base README
- the GHCJS FFI Wiki Page
- source code of various things, such as ghcjs-base, or the internal modules of Miso.
Wrappers for the browser APIs in ghcjs-base exist, but aren’t yet convenient to use. Some things, such as manipulating JSVal, seem quite tedious, though it’s possible that I haven’t found the best method to work with them yet.
I realised fairly early that using Aeson to deserialize large things such as GeoJSON is slow compared to the browser’s built-in JSON parser.
I wanted to use Aeson more to build “options” objects for the JavaScript libraries, via the function toJSVal_aeson :: ToJSON a => a -> IO JSVal. However it’s not really possible to embed another JSVal (for example a big blob of GeoJSON) into an Aeson Value.
Don’t accidentally add a semicolon to your Nullable foreign javascript expressions, or they will always be Null.
Leaflet in Miso
It’s fairly straightforward to wrap the Leaflet APIs you need in GHCJS.
Integrating this with Miso is doable but less straightforward. Because there are no lifecycle hooks, you need to get creative/hacky when initialising Leaflet.
I create the map after receiving the miso initialAction message. For this app it’s OK because the map is always visible. Destroying the Leaflet instance and event handlers is not done, so there is a resource leak here.
The map layers are created in response to the message which is received when the browser XHR completes. The Layer instances are cached in a variable accessed through an MVar. This is not pleasing for me, and makes the code a little bit convoluted.
Moreover, another problem with creating layers in response to messages is that map layers are destroyed and recreated regardless of whether the data has changed. There needs to be more tracking of state in the tour map code, but I haven’t added it yet.
Relevant code:
Events/callbacks from Leaflet back to Miso
A significant source of difficulty for me was handling click events and tooltips. Layer click events turned out alright, after learning more about the Elm Architecture and looking at this example as well as the source code for Miso.Subscription.Mouse. A Sub example in the docs would be quite helpful.
Layer tooltips are more problematic. They work by registering a synchronous callback to supply the tooltip text based on event object properties (i.e. the feature which is under the cursor). However it’s possible that the metadata required to show tooltips gets loaded after the layer is created.
Basically there is a race because the tooltip handler only has in scope the state of the Model at the time of event registration. I haven’t solved this problem, but luckily it is fairly unlikely to occur (fingers crossed).
Relevant code:
Chart.js in Miso
Wrapping the Chart.js scatter chart was also fairly straightforward for this application.
Due to limitations of Chart.js, it’s difficult to resize an existing chart canvas. This is something I wanted so that the y-axis scale be fixed in proportion to elevation. The solution is to destroy and re-create the chart when the dataset changes.
As with Leaflet, it’s necessary to hack around the lack of lifecycle hooks in Miso. When the elevation data arrives back from XHR in an Action message, the code destroys the previous chart (if it exists), finds the canvas DOM element with getElementById, and initialises a new chart.
The chart is only shown on the tour day view, so when changing view, the chart may need to be destroyed. This is not done in my app, so is probably a resource leak. Also when changing view, the diffing DOM update behaviour of Miso leads to remnants of previous charts being left behind. The solution is to nest the chart canvas deeper within the view so that sibling elements are also cleaned up when the DOM updater removes their parent element.
The thing that stuck me most when using Chart.js is that between writing the VueJS app and Miso app, I had unknowingly updated from v2.6.0 to v2.7.0. The developers had decided that scatter charts should never have had lines joining the points (true), so fixed the default behaviour without mentioning it in the release notes, or mentioning the relevant option anywhere in the docs or examples. The result was me trying for ages to figure out why the elevation chart was not showing anything. Oh well, can’t complain, it’s free, and I’m free to fix the docs myself (won’t though).
Relevant code:
Fetching and Caching
In the Elm Architecture, asynchronous processes begin and end with Action messages. So if you need to get data, you have a FetchSomething URI which initiates the XHR, and SetSomething Thing which updates the Model from the response.
If you have seven different types of data to fetch, then you have seven fetch/set action pairs. Unless – you define a GADT FetchThing a for fetching a. Then you only need two Action messages: FetchData (FetchThing a) and SetData (FetchThing a) a.
The existential quantification GHC extension is needed to stuff these messages into the Action type.
The function fetch :: FetchThing a -> IO a implements fetching and interpreting responses.
The FetchThing a type also supports caching of fetch actions in a dependently typed map. This makes it quicker to switch between views because the XHR and JSON parsing don’t need to be done twice.
Relevant code:
Asynchronous Code
Related to caching, it’s nice to ensure that simultaneous HTTP requests for the same resource don’t occur.
Having the full GHC runtime available in the browser is a mixed blessing. Where previously your code was single-threaded and event-driven, it now executes concurrently in more ways that you can imagine. Unfortunately, there is no performance gain whatsoever in return for this drastic complication.
Thankfully, we have the excellent Control.Concurrent.Async package. This is much much better than writing code with callbacks or promises.
So basically, add async to your cabal file now and don’t even think about using IORef because it won’t work.
Relevant code:
Data Transfer Format
The build process initially produced JSON and GeoJSON files because obviously these are well supported by JavaScript libraries and decoding is done natively by the browser.
JSON is a decent enough interchange format because it’s widely supported. File sizes are quite large, but much smaller if automatic compression is enabled on the web server.
But having Haskell on both ends of the application opens up exciting possibilities for data transfer. Something better and more efficient to parse could easily be used, though I haven’t investigated this yet.
Relevant code:
Compiler targets
It is annoying that Miso doesn’t fully compile with GHC and certain modules are are GHCJS only. I have quite a few #ifdef GHCJS_BROWSER spread around the code.
Reflex uses the amazing jsaddle so all JavaScript functions available in ghcjs-base are available in normal GHC. This allows using the ghci interpreter for new GHC versions (otherwise, ghci is only available for GHCJS 7.10.3).
It probably would have been easier for me just to use GHCJS 7.10.3 to get a working ghci, however I used GHCJS 8.0.2 because that is what the Shake build was using and I wanted library versions to be the same.
Dev Server
Normally, the easiest way to test a static site is with python3 -mhttp.server 8000. However, this doesn’t work too well with HTML5 “history mode” navigation.
The solution is to use something with more options for routing – devd for example.
But actually it’s not that hard write a dev server script with Warp, Network.WAI, and wai-extra. This also allows some tricky routing for .js files coming from both the GHCJS build and Bower components.
Relevant code:
Nix
Nix handles downloading and caching of the necessary software dependencies for building the site. This provides a repeatable development environment.
Currently I do version locking by setting NIX_PATH to a separate nixpkgs worktree, though it’s probably better to specify the nixpkgs revision within default.nix.
nix-shell
I have one shell environment for the Shake build which includes tools such as gpsbabel, rsync, etc. The other shell is a GHCJS compiler with packages necessary to build the frontend.
bower2nix
The frontend dependencies Leaflet, Chart.js, and the Bulma CSS Framework are kept with bower2nix. In the development shell, the environment variable BOWER_COMPONENTS will refer to the assembled Bower components.
NixOS
Once the site and data are built, they are transferred to a web server running NixOS. With the NixOS NGINX module, it is really easy to configure the web server optimized for a HTML5 single-page application. These are the relevant settings:
services.nginx.virtualHosts."lorrimar.id.au" = {
  serverAliases = ["www.lorrimar.id.au"];
  enableACME = true;
  forceSSL = true;
  root = "/srv/www/lorrimar.id.au";
  extraConfig = ''
    gzip on;
    gzip_types text/plain text/html application/json;
  '';
  locations = {
    "/tour/".tryFiles = "\$uri /tour/index.html";
    "~* ^/tour/.*\.(html|css|js|xml)".extraConfig = "gzip_static on;";
  };
};
Summary
This was an report of my experience developing the tour browser web site. I have used powerful tools which are not yet widely understood in this area.
The decision of building everything as static files and not having an app server is a good one in this case, and simplifies both implementation and deployment.
The Shake build system is excellent, and for anything but the simplest builds it’s worth using, even if you haven’t learnt Haskell yet.
Deployment with NixOps and NixOS works very well.
If I wanted to build a web frontend as quick as possible, then I would still use VueJS. Re-implementing the frontend in Haskell Miso took more time for various reasons.
However I see great potential for Miso (and Reflex) as viable frameworks for large and complex applications.